Rapid Data Retrieval
From the Cloud - Access Your Data in Minutes!
From the Cloud - Access Your Data in Minutes!
Ostia Solutions are a Software Integration company based in Bray, Co. Wicklow.
We have customers in over a dozen countries in a variety of sectors including the following:
Our team specialises in:
We can help you to make the best use of your data in a very short space of time.
This site is dedicated to showing you examples of how this can help your organisation.
Take a look at our video to see what we mean.
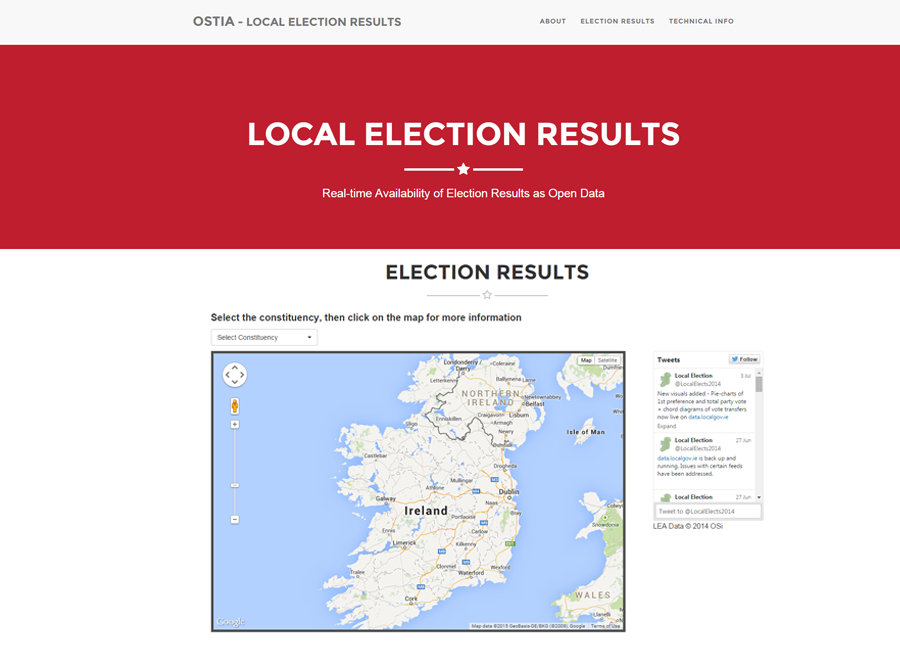
Case Study and Demo of Recent Elections.

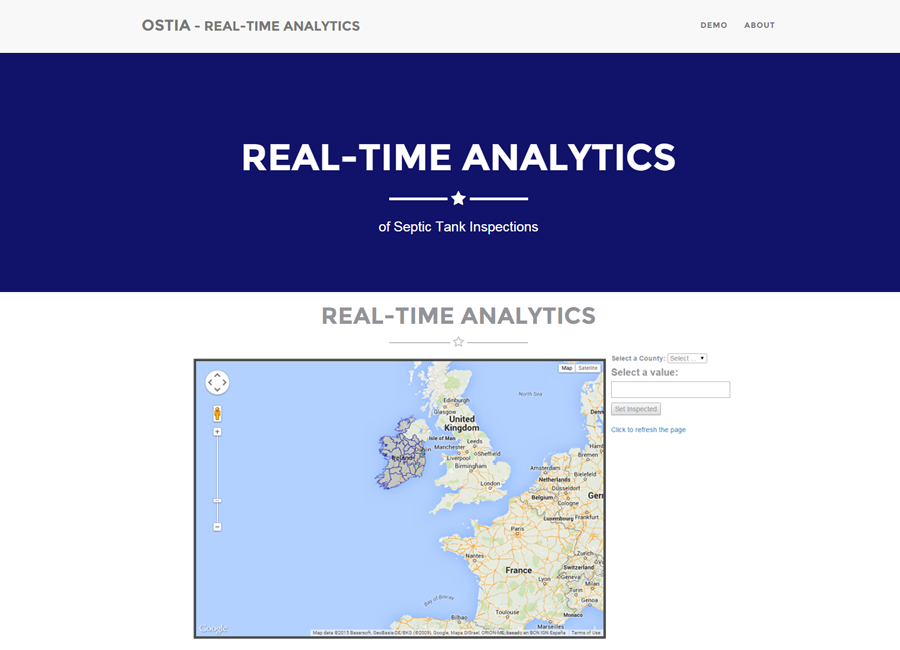
Real-time Availability of Data.
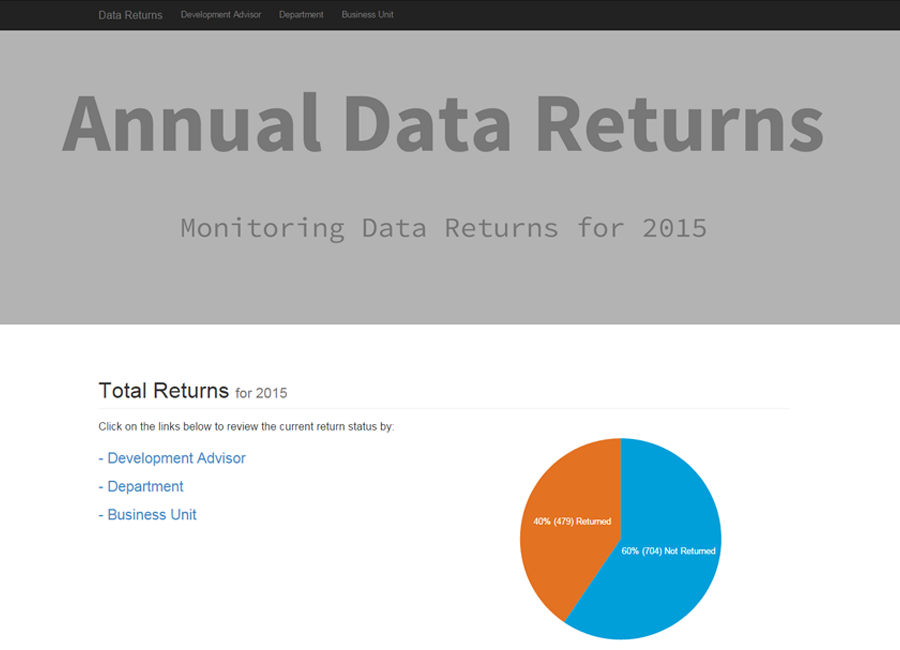
Case Study and Demo of Data Visualisations.
Process Improvement through Data Visualisation.
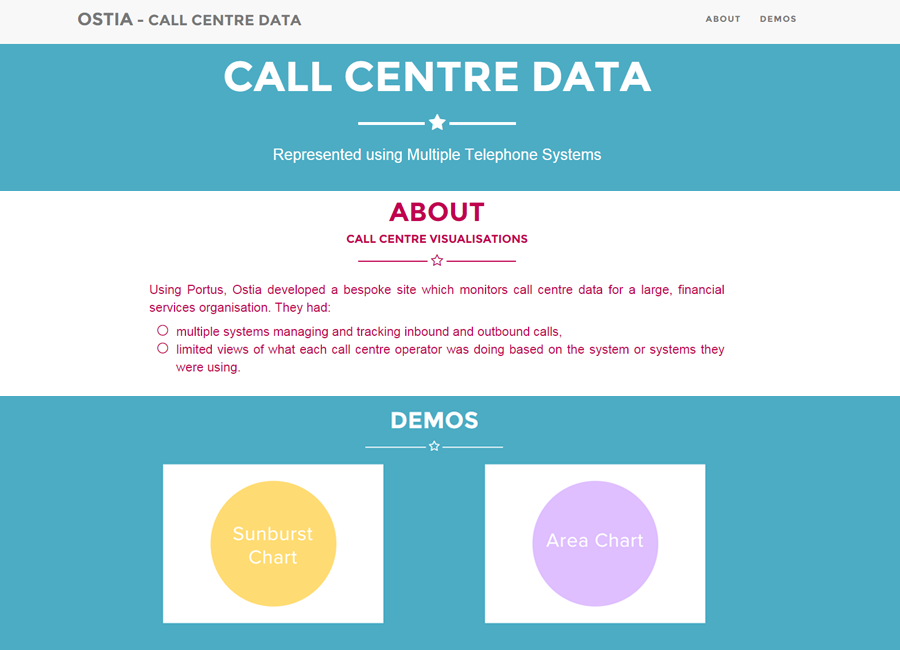
Representation of Call Centre Data using Multiple Telephone Systems.
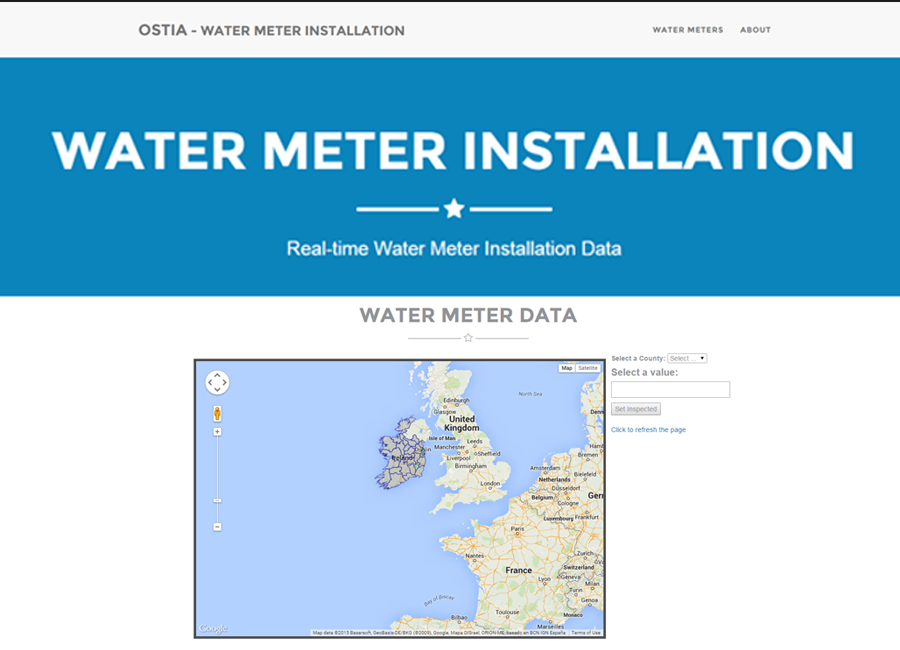
Comprehensive Analytics using Multiple Data Sources.
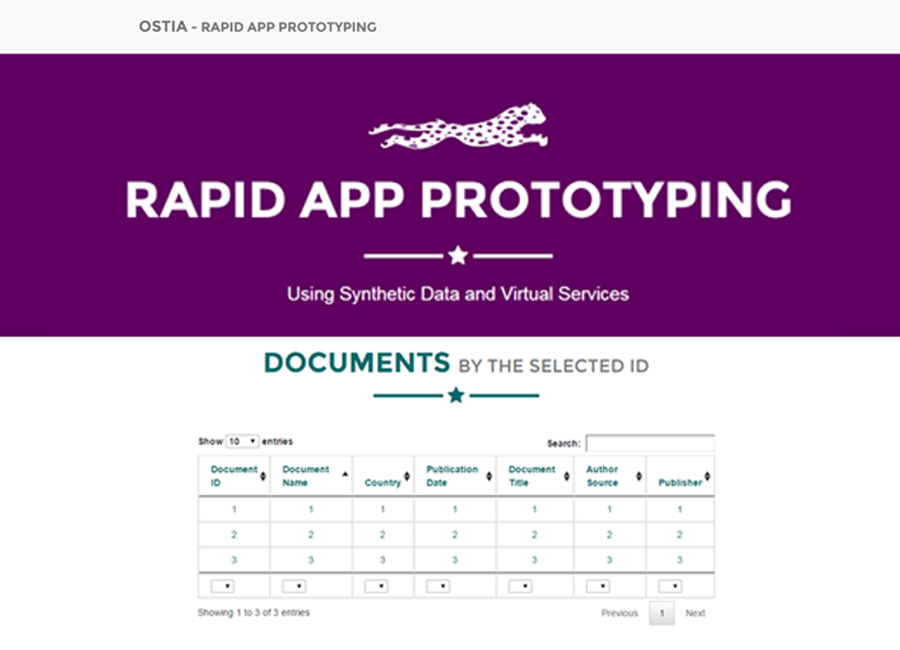
See how we can Prototype for a Tender Bid in 2 Hours.
Demo Your Application in 2 Hours.